Closeness by SMS
During this week long Information Design course, we were asked to create an information graphic from our personal communication data.
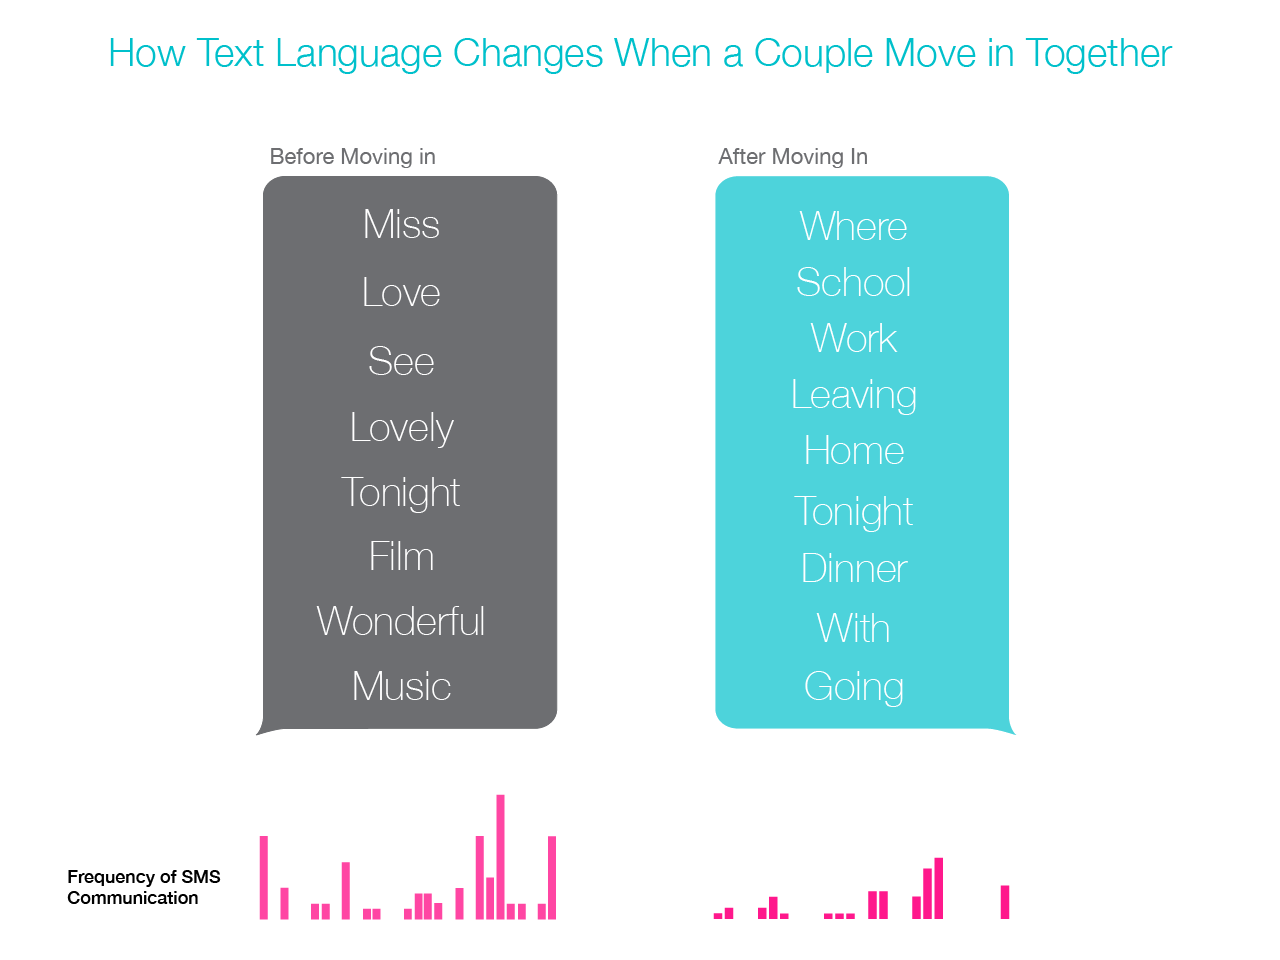
Analysing SMS data, this information graphic shows how the SMS communication of a couple changes when they move in together. The findings were very interesting. Not only SMS length, frequency and number of SMSs per conversations lessened, but also semantics and language developed a greater functionality. The biggest challenge here was trying to show a continued affection while keeping to the data and the visual style of the graphic.
The data was collected over a 2 month period spanning pre and post move.