Communication Patterns
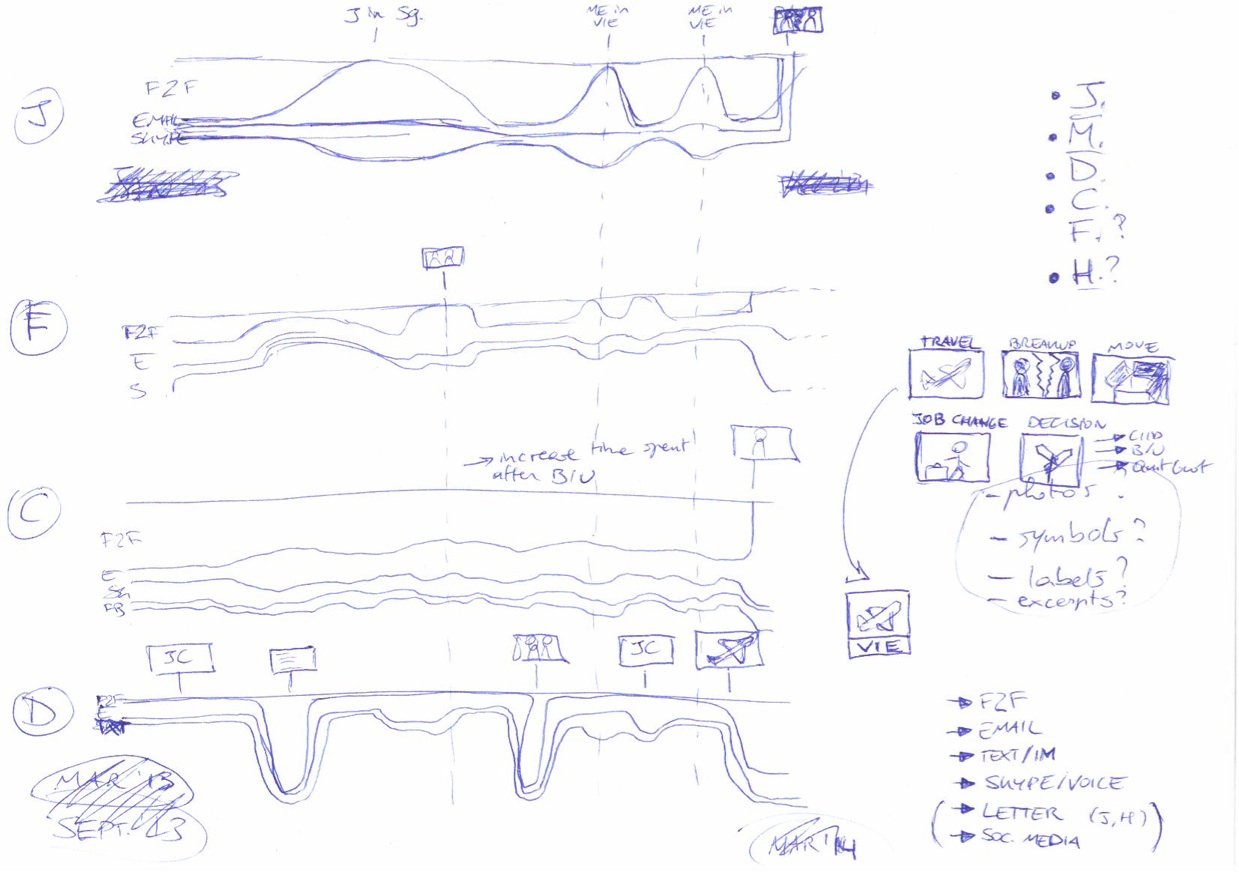
This infographic shows the changes in communication patterns with four people close to me as I underwent several important life events.
The graph examines how factors such as geographic separation and dramatic events such as a breakup or job change affect the forms and volume of communication between myself and four people I am or was closest to. The graphs track face-to-face interactions, email, text and instant messages, voice and Skype calls, social media, and physical letters.
The data is presented in the form of stream graphs, which excel at showing overall volume in a visually appealing way. Each colored segment sits on top of the one below it, rather than behind it. I created the graphs in Javascript and edited the final graph in Illustrator.