Data Visualisation
Explore storytelling and creating meaning out of data. Learn how to turn data into engaging visualisations using a variety of tools.
Enrol here!
Workshop Dates: July 13-17, 2020
Faculty: Annelie Berner & Francis Tseng
What is Data Visualisation?
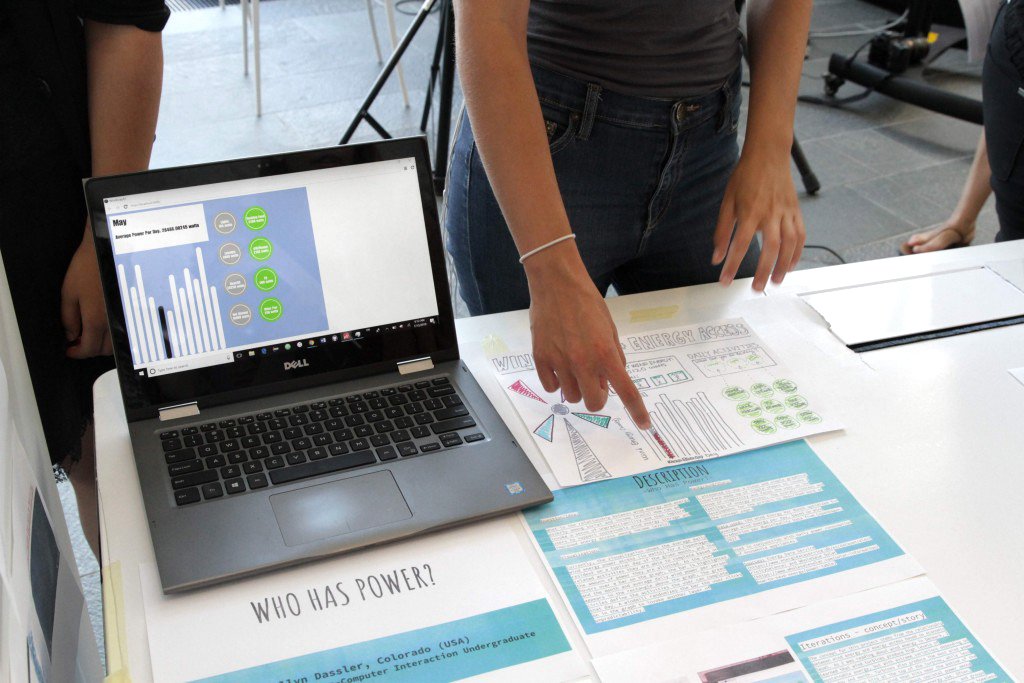
Visualisation is an increasingly important part of making sense of our highly networked, data-rich world. Using a combination of interpretive methods and representational techniques, we will explore various ways visualisation can make invisible relationships, structures, and stories visible. Drawing inspiration from the history of visualisation, the principles of interactive media, and the foundations of graphic design, we will learn how to extend the capabilities of ordinary perception to tell stories and draw insight from information.
What will you learn?
- how to collect, classify, and encode data
- the foundations of data visualisation
- using metaphor, visual relationships, and interaction to make meaning out of data
- skills to tell a story with data
- analog and digital techniques for making visualisations
How will you learn it?
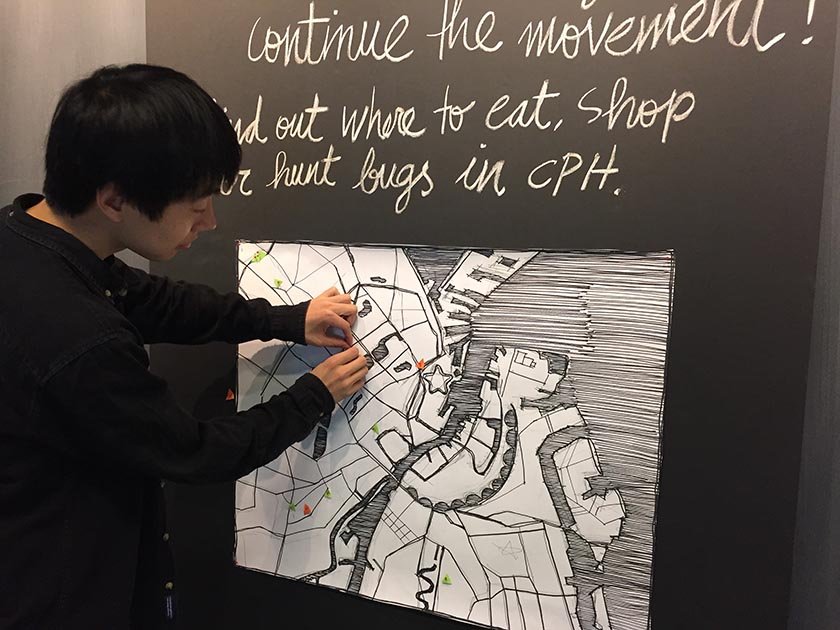
During this 5 day workshop, we will use analog and digital techniques to practice creating compelling data visualisations using a variety of data. We will learn how to collect, classify, encode, and display data and construct relationships and meaning. The course will involve drawing, prototyping, and programming using data.
Is this for you?
Yes, if you want to enrich the way you work with data.
There are no prerequisites for this workshop.
What do you need to bring to the workshop?
- A computer - ideally Mac
- Notebook & pen
Enrol now: There is a maximum number of 20 places available for each workshop, first come first served. Enrolment will be closed when the workshops are full.