Eyesight vs. Closeness
In this course, our challenge was to find meaning through information design.
We were asked to utilise visual processes to explore and find intent in data by comparing the communication channels we use and the relative closeness we feel to the people we are talking to.
Thanks to modern technology, people can easily communicate with their friends through their smartphones and computers; however, this has been shown to cause deterioration of people’s eyesight by staring at screens for extended periods of time. Therefore, my intention was to find out the relationship between my eyesight and the people I care about.
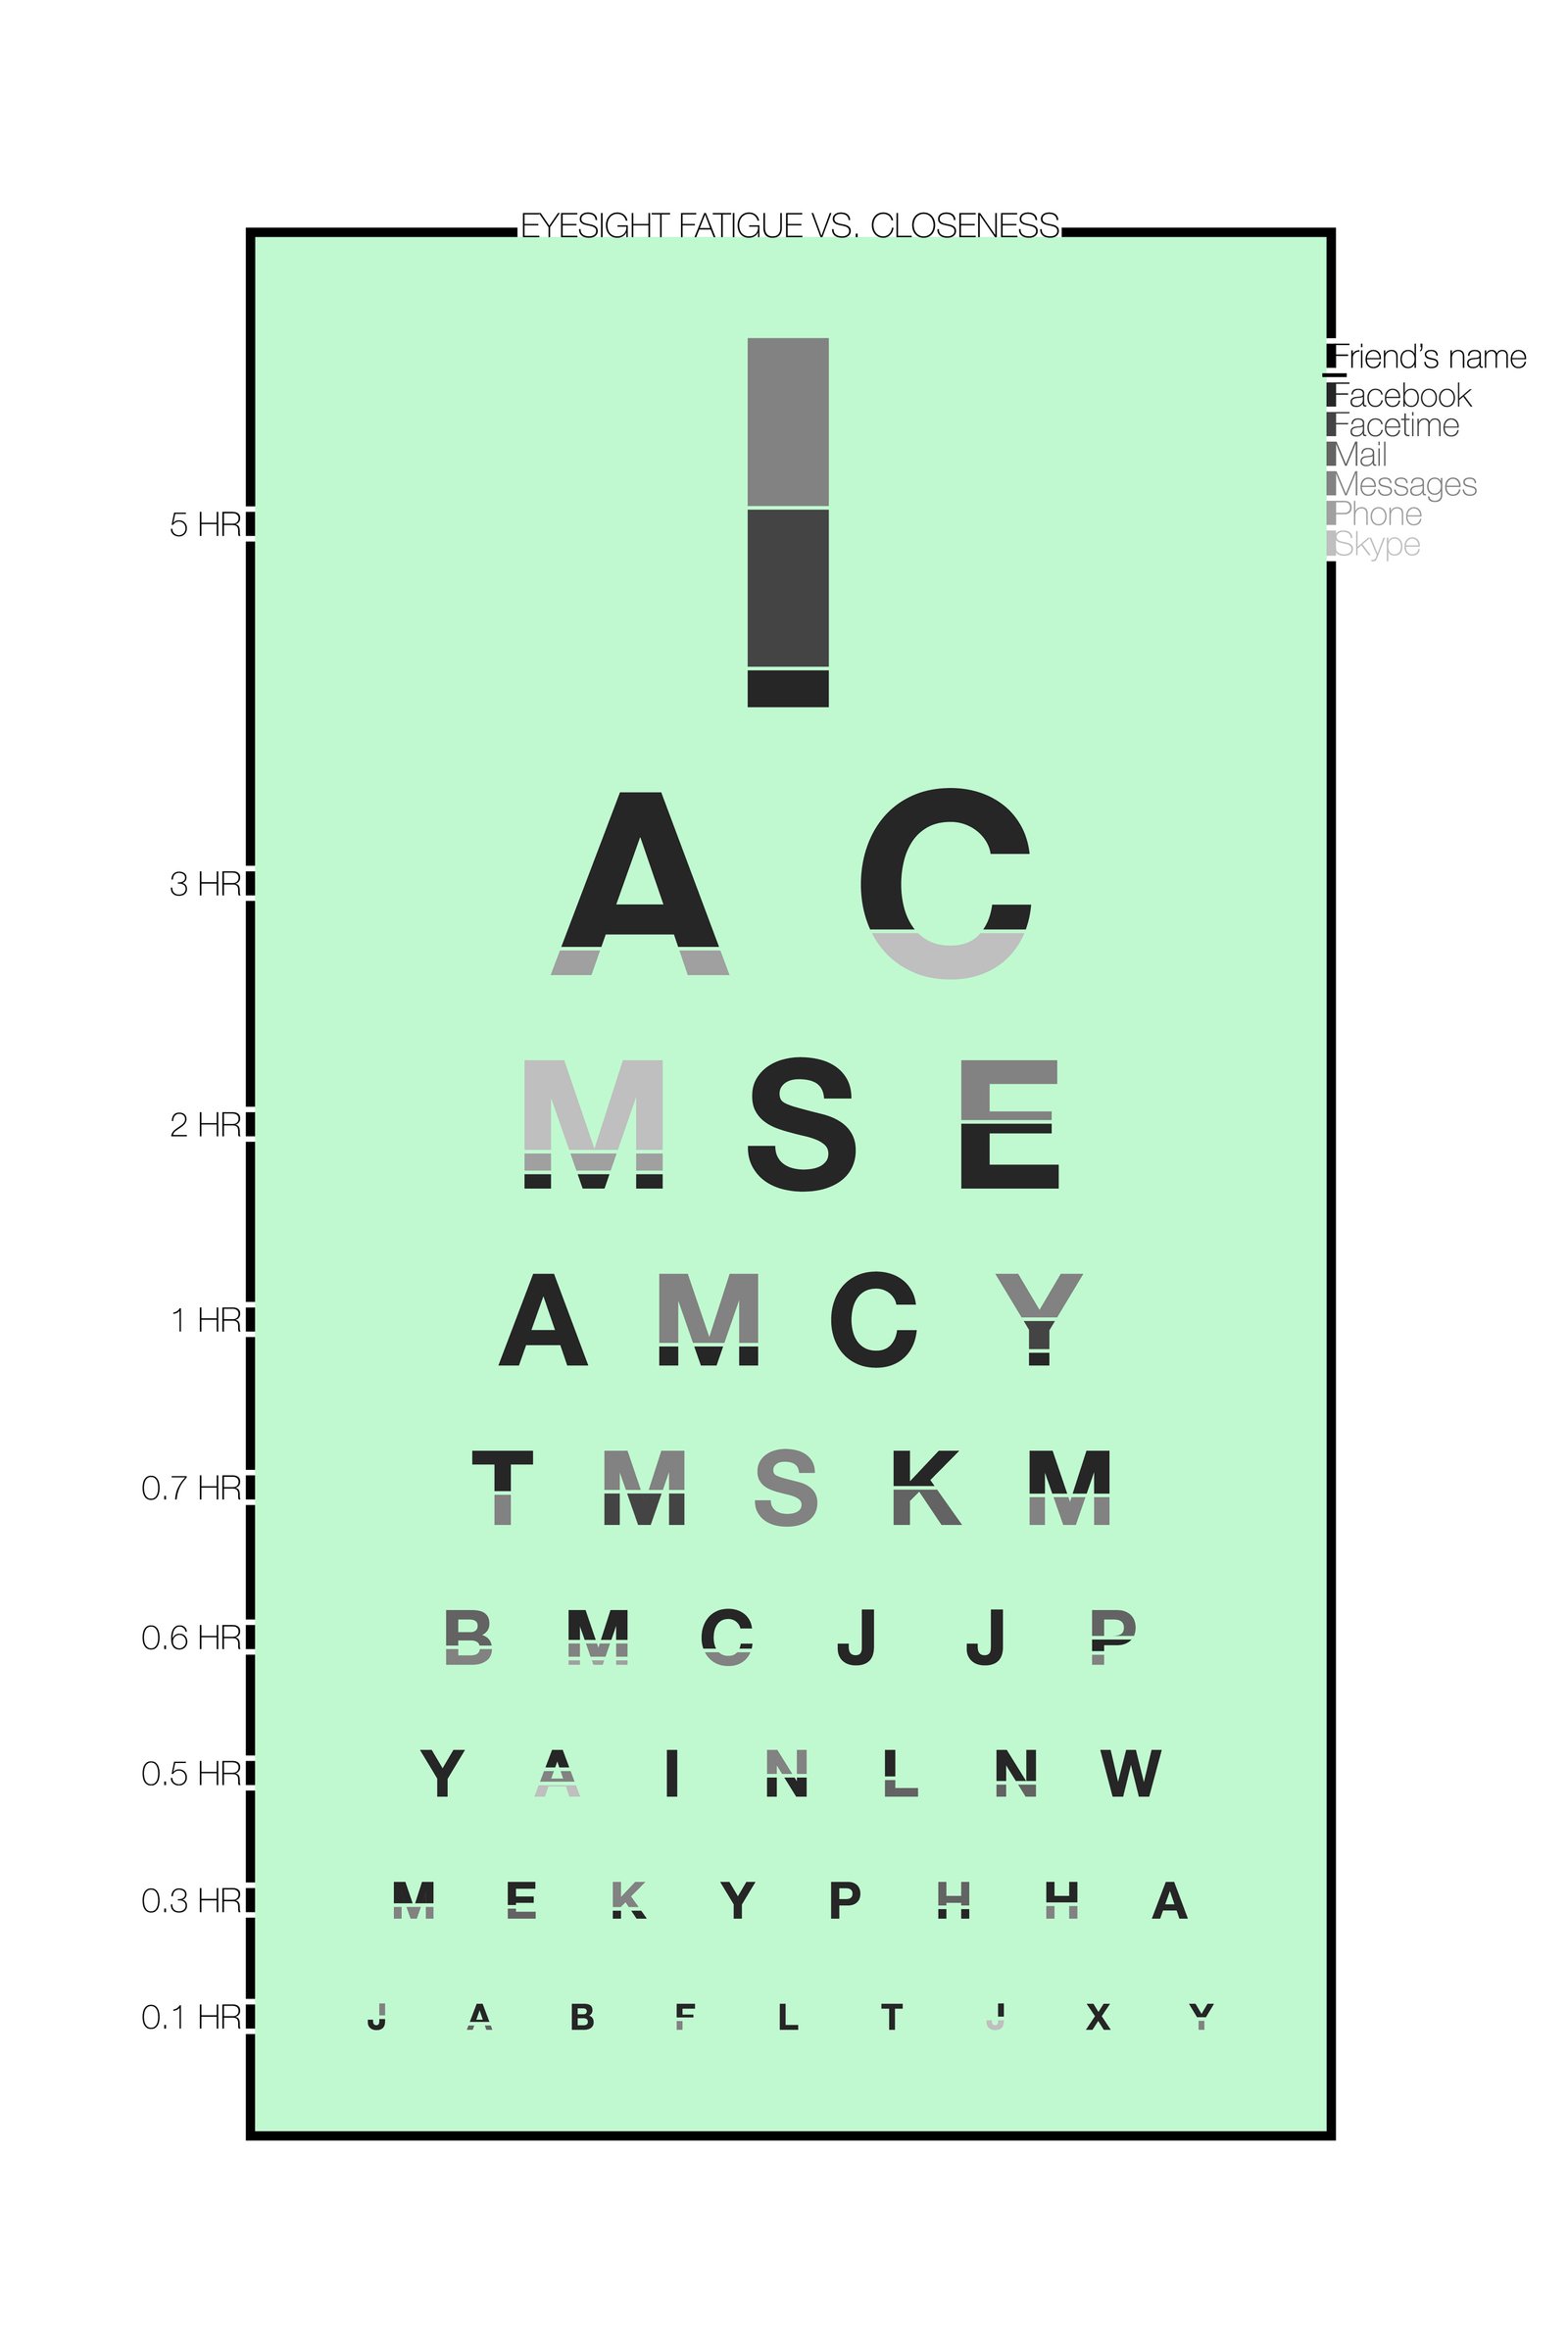
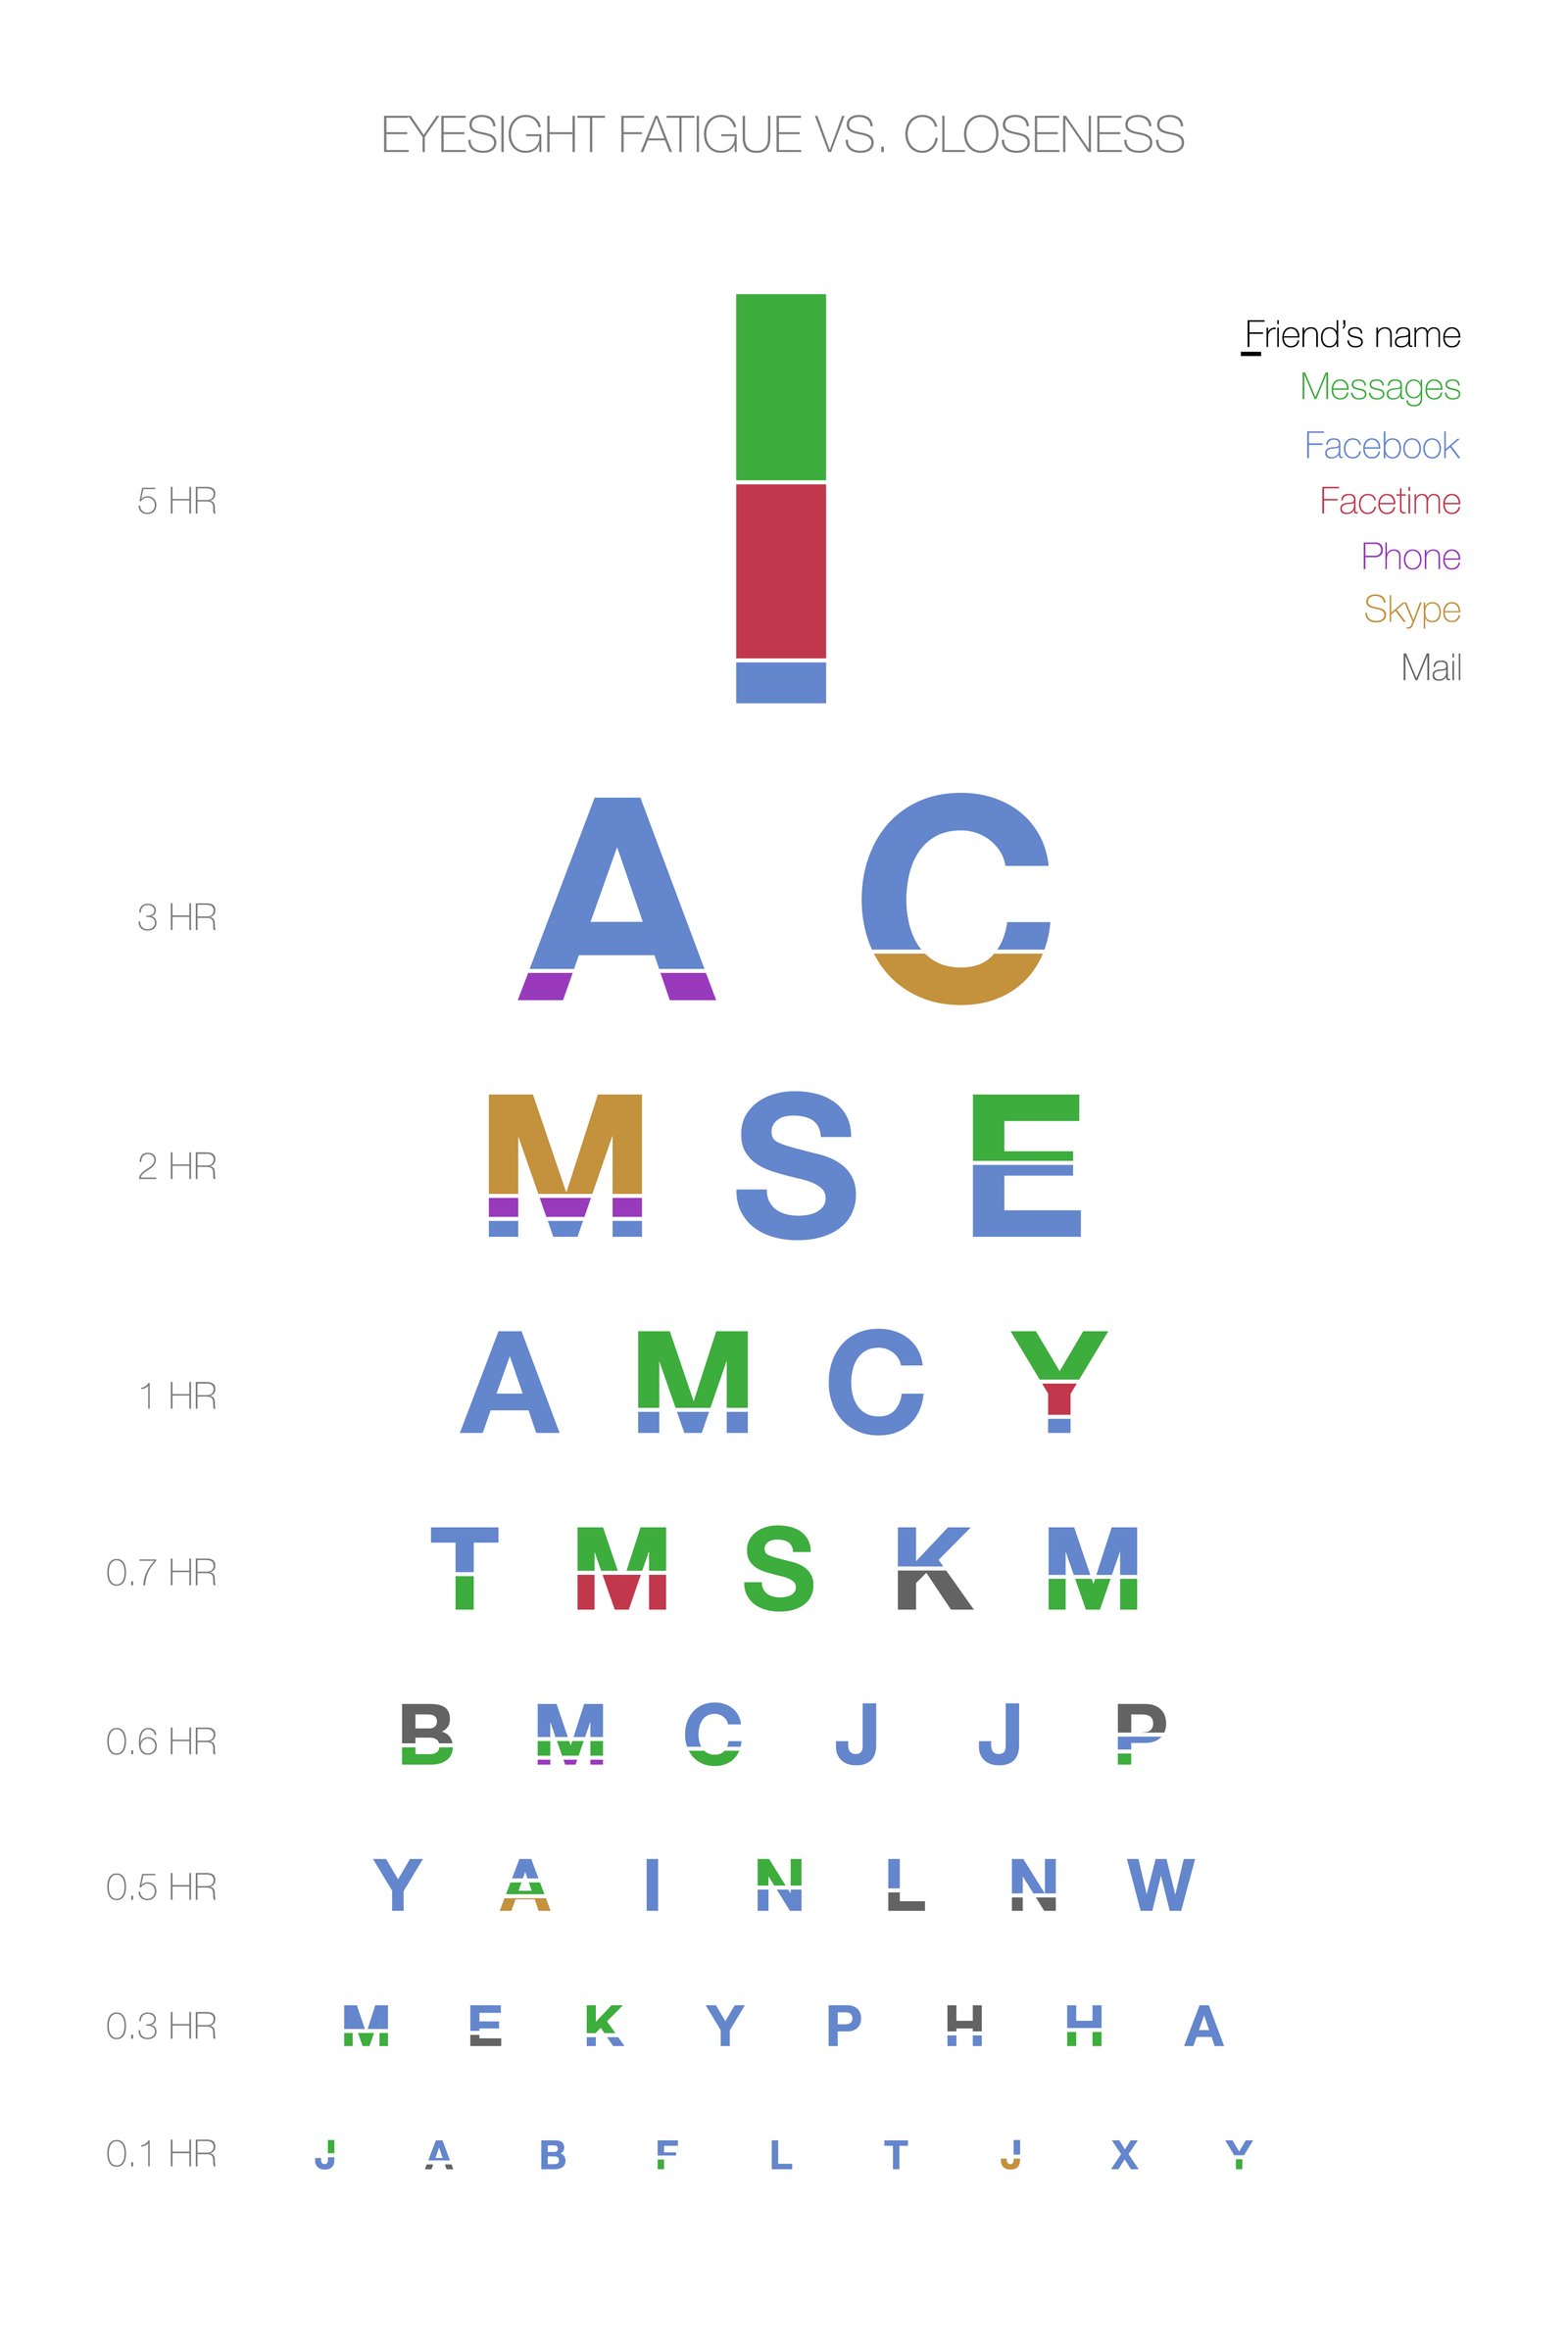
During the ideation phase, I was inspired by the visual style of eyesight examination graphs; hence, I tried to apply this metaphor to the infographic to use a familiar visual language that would resonate with viewers.
This infographic demonstrates how much time I spent with different friends and how many communication channels I used for each person in a week. Each capital letter represents a subject’s first initial. The colour and size of each coloured segment illustrates different communication channels and the time I spent with each respective person.