Profile Picture Changes and the Seasons
The brief was to delve into our Facebook data and find interesting patterns to tell a story in the form of a single info-graphic (1280 x 800) for the screen. I started by looking at some of the Facebook Analytics provided by sites like Wolfram Alpha but soon realised that to tell a compelling story, the data needed to be exciting and maybe not the obvious as is visible on the Facebook interface.
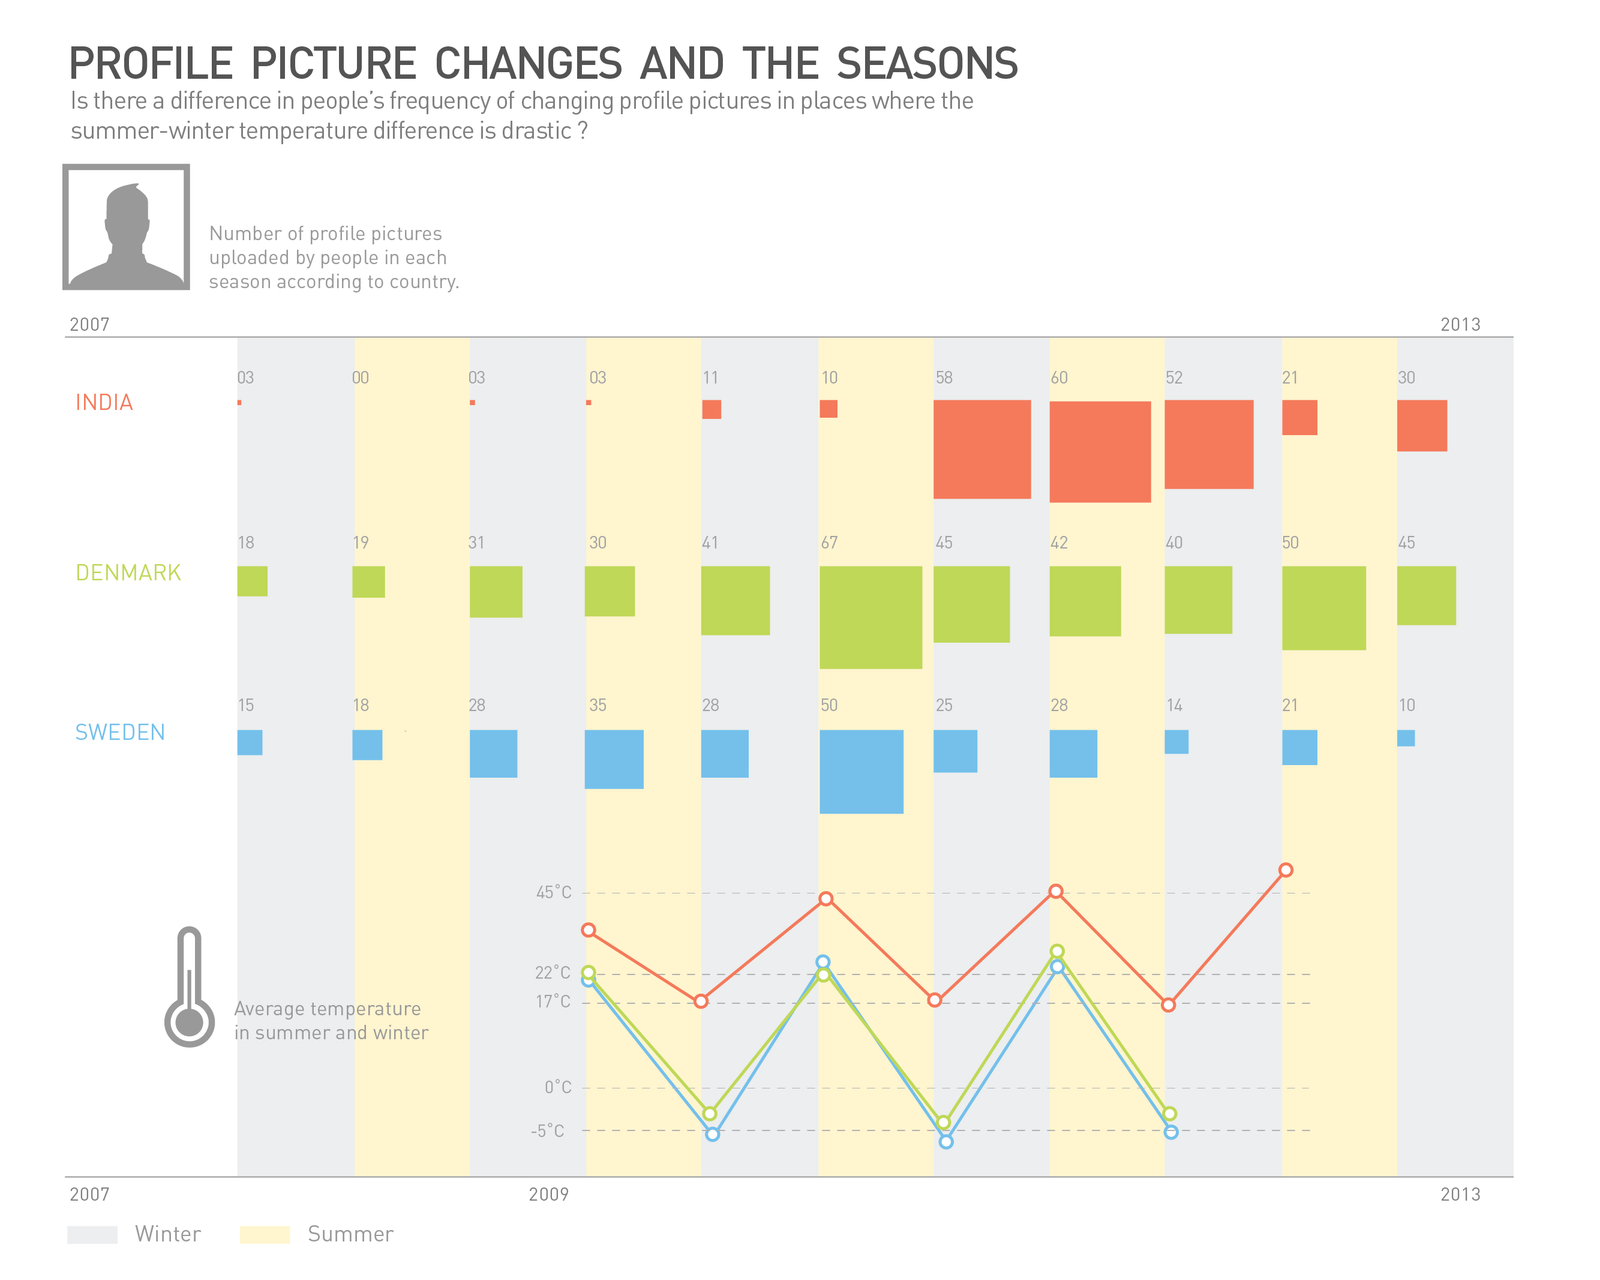
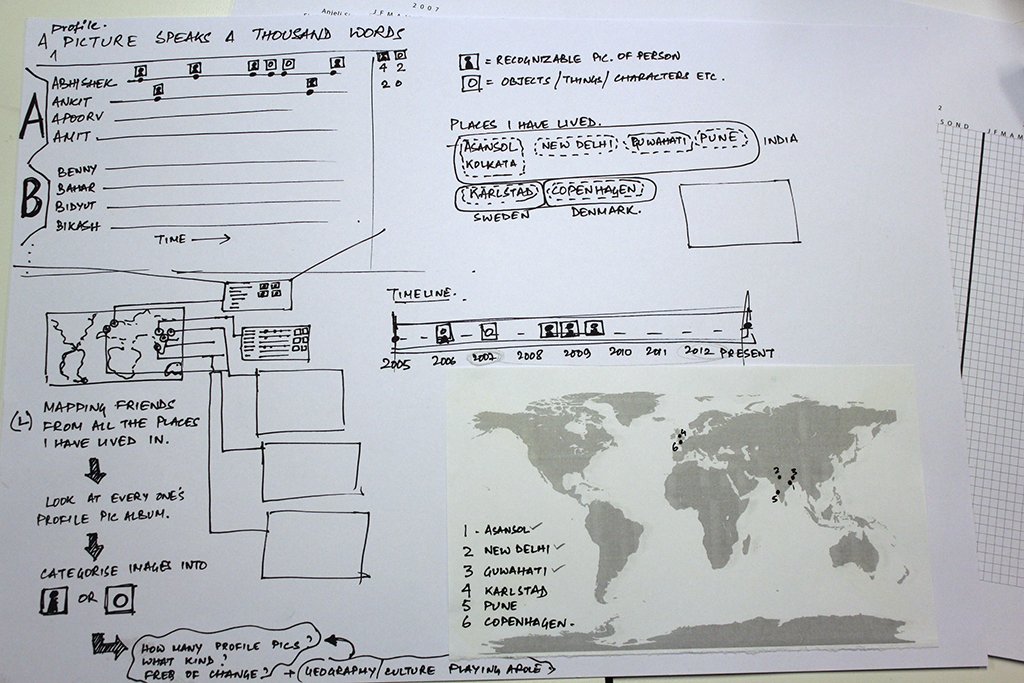
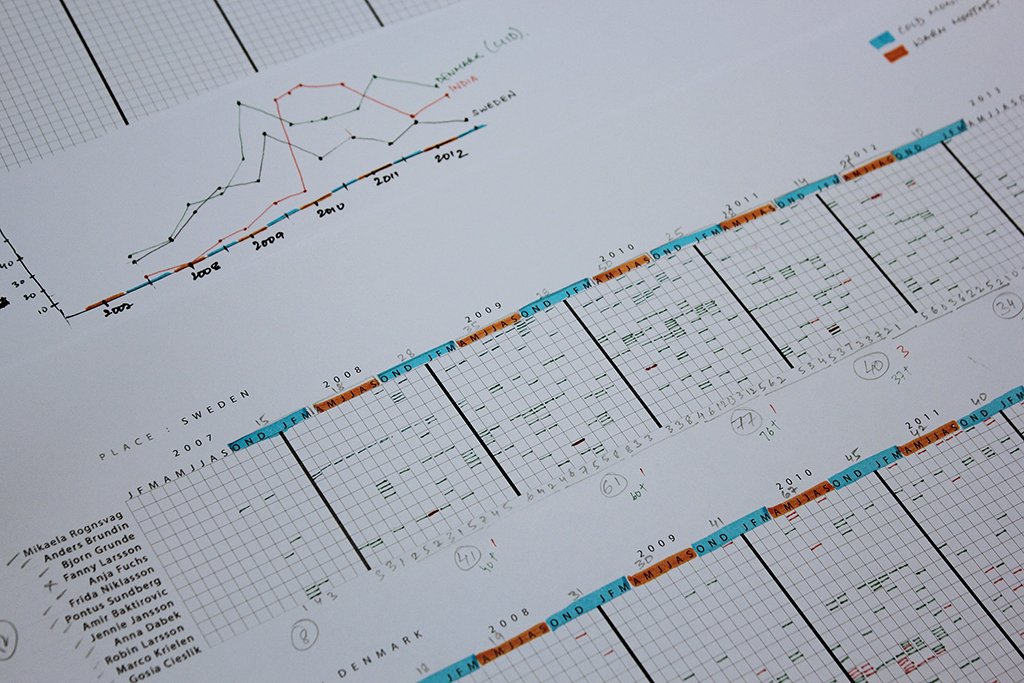
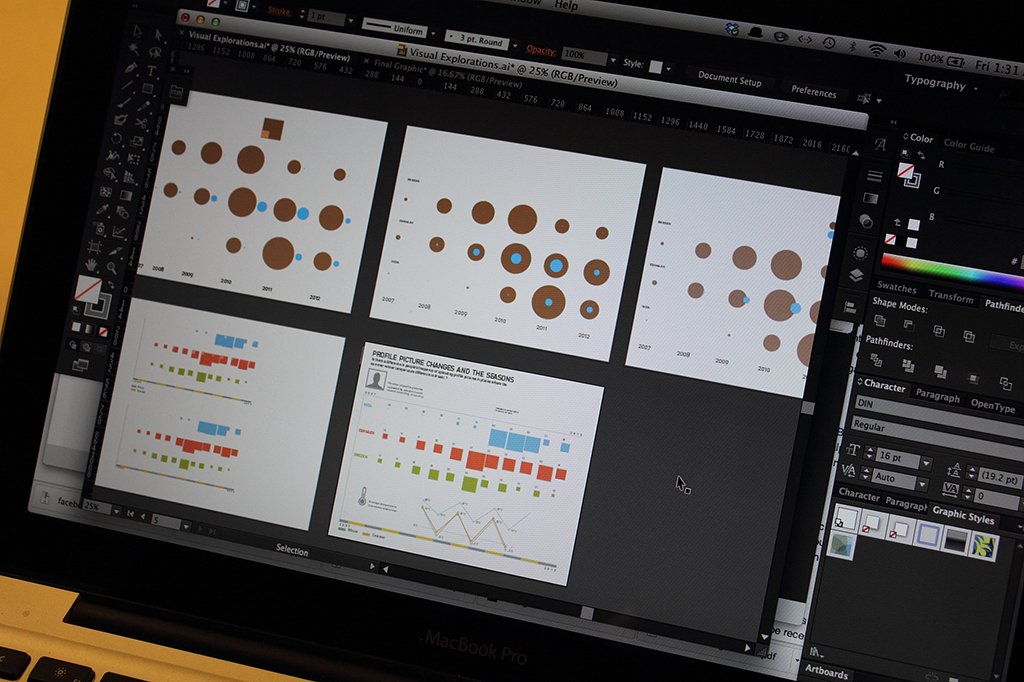
So I started by looking at profile pictures of my friends. Manually, I took a sample of 60 friends across three countries I have lived so far - India, Sweden and Denmark. I designed my own data logging sheet to log the frequency of changing profile pictures by people over time and what kind of pictures were being uploaded - recognisable pictures of themselves or abstract/symbolic ones.
While doing this process interesting patterns started to emerge - Swedish people seemed to upload more profile pictures in summer while for India the change was not so drastic across seasons. I decided to distill this fact in the form of a graphic.
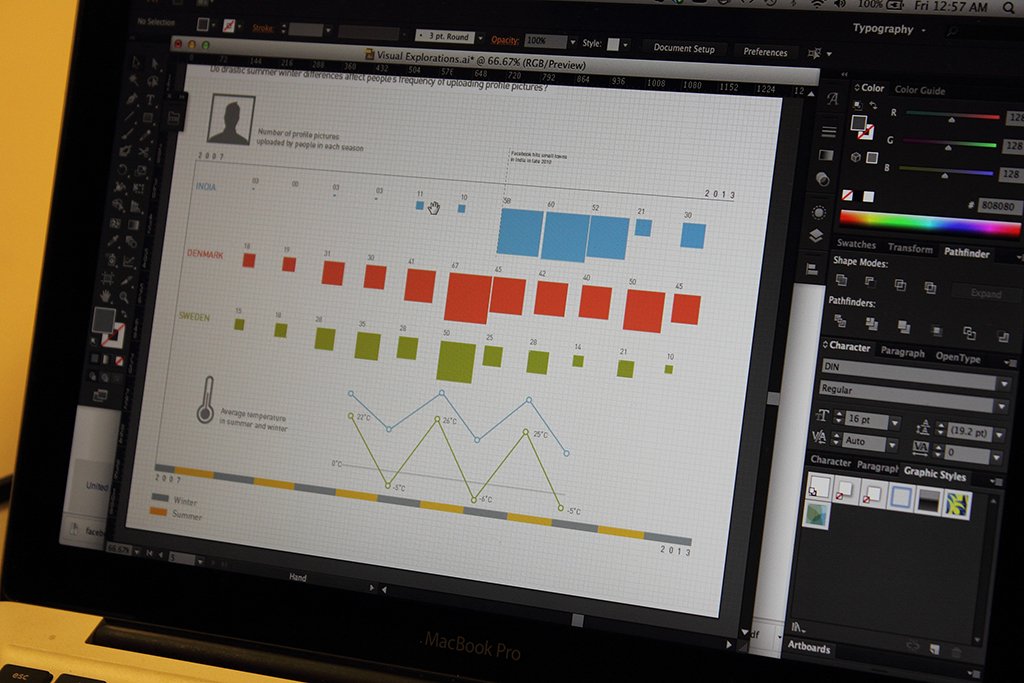
The visual design part was about being sensitive to the principles of good information design - like proper signal strength of different page elements to lend a proper reading order and maintaining suitable data-ink ratio.